

You're measuring everything. You don't know what works.
Follow the control, not the conversation.
You run two measurement systems. They disagree on everything.
Not a little. Not on the margins.
Your marketing mix model (MMM) and your multi-touch attribution system (MTA) are measuring the same spend. Under current privacy-constrained conditions, simulation work puts the correlation between their channel-effectiveness rankings at r=0.02. If that number means nothing to you: zero is no relationship, 1.0 is perfect agreement. These two systems score 0.02. That’s not a rounding error. That’s noise.
This sits at the centre of marketing measurement in 2026. Not that we can’t measure. We measure obsessively. But the dashboards contradict each other, the platforms reporting the numbers have a financial interest in making them look good, and the methods we’ve relied on for a decade are collapsing under the weight of privacy regulation they were never designed to survive.
You are drowning in dashboards and starving for truth.
This edition is about why that happened, what’s actually broken, and what it looks like when you fix it.
---
The signal collapsed faster than anyone planned for.
The attribution systems most marketing teams built their infrastructure on were designed for a world of persistent cookies and cross-site tracking. That world is gone.
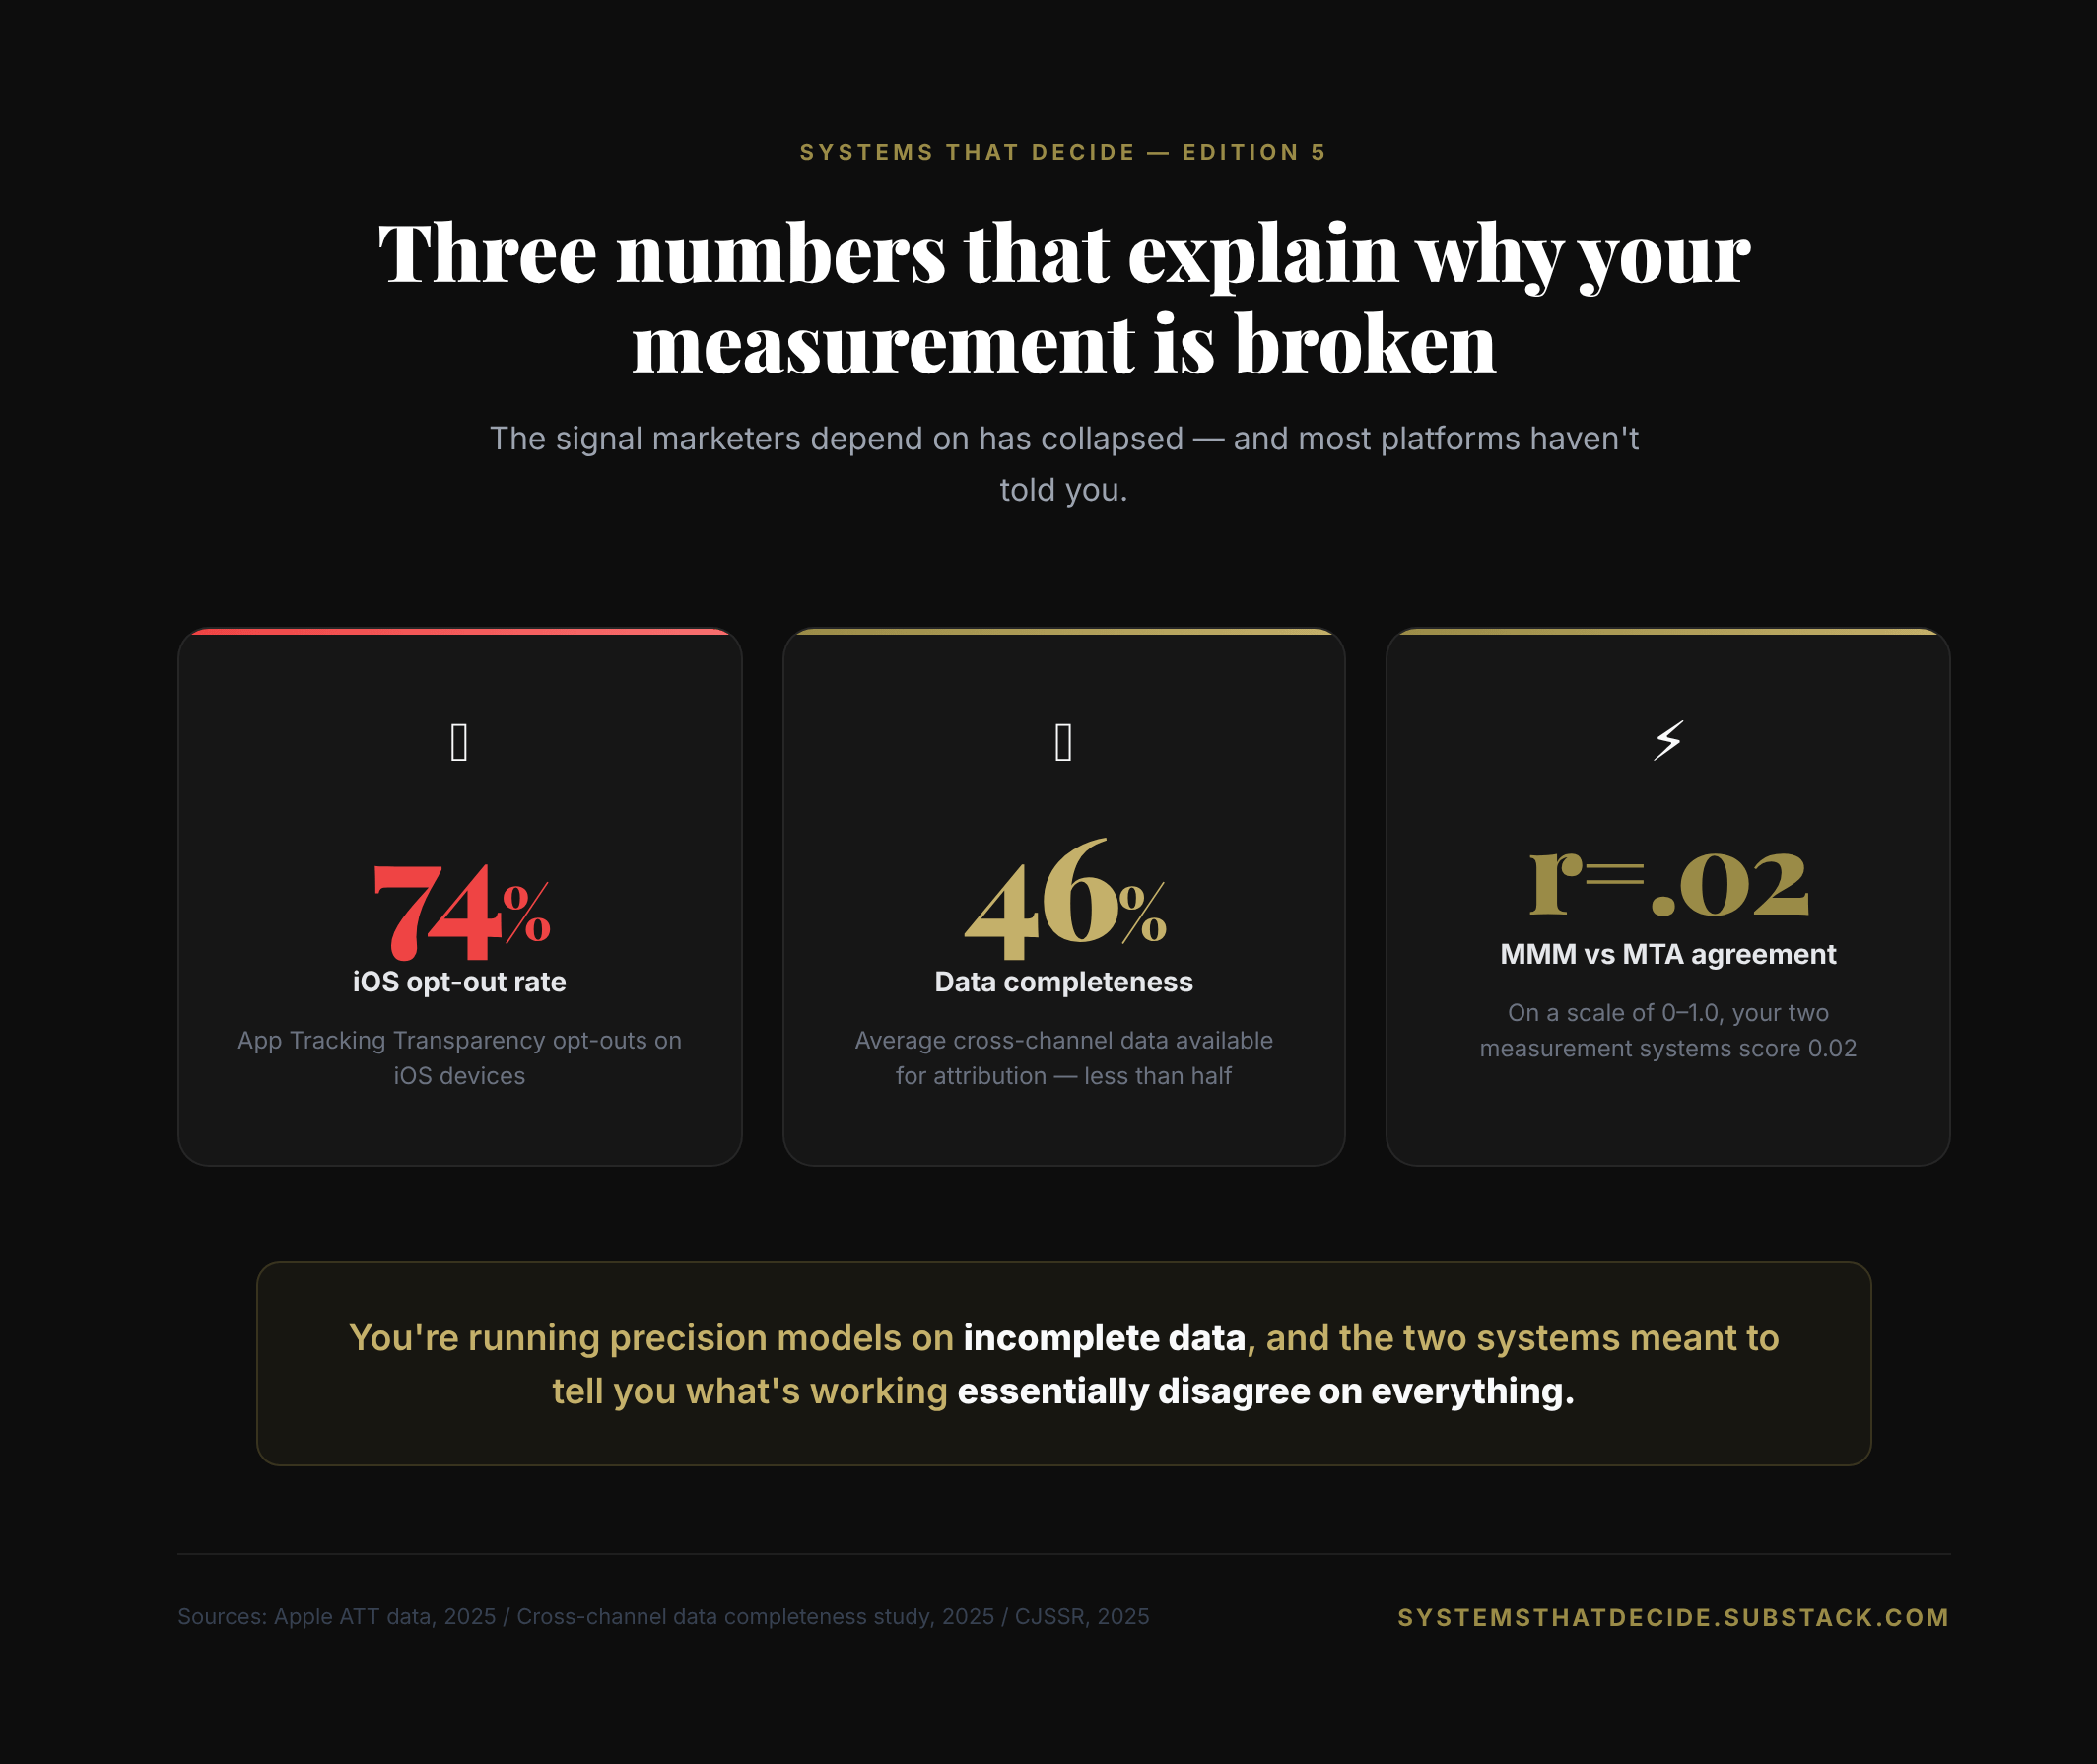
iOS’s App Tracking Transparency runs a 74% opt-out rate and the third-party cookie is functionally dead in most browsers. Modelling of the current privacy landscape puts average cross-channel data completeness at around 46%. Less than half.
You’re trying to do precision attribution with a dataset that’s missing more than half its observations. The models don’t tell you that. They just give you numbers.
---
The platforms grade their own homework.
Here’s the structural problem sitting underneath the data quality problem.
The companies you pay to run your media are the same companies that tell you how well your media performed. That’s the conflict. It’s structural, not personal.
The numbers they report are systematically higher than what independent measurement finds.
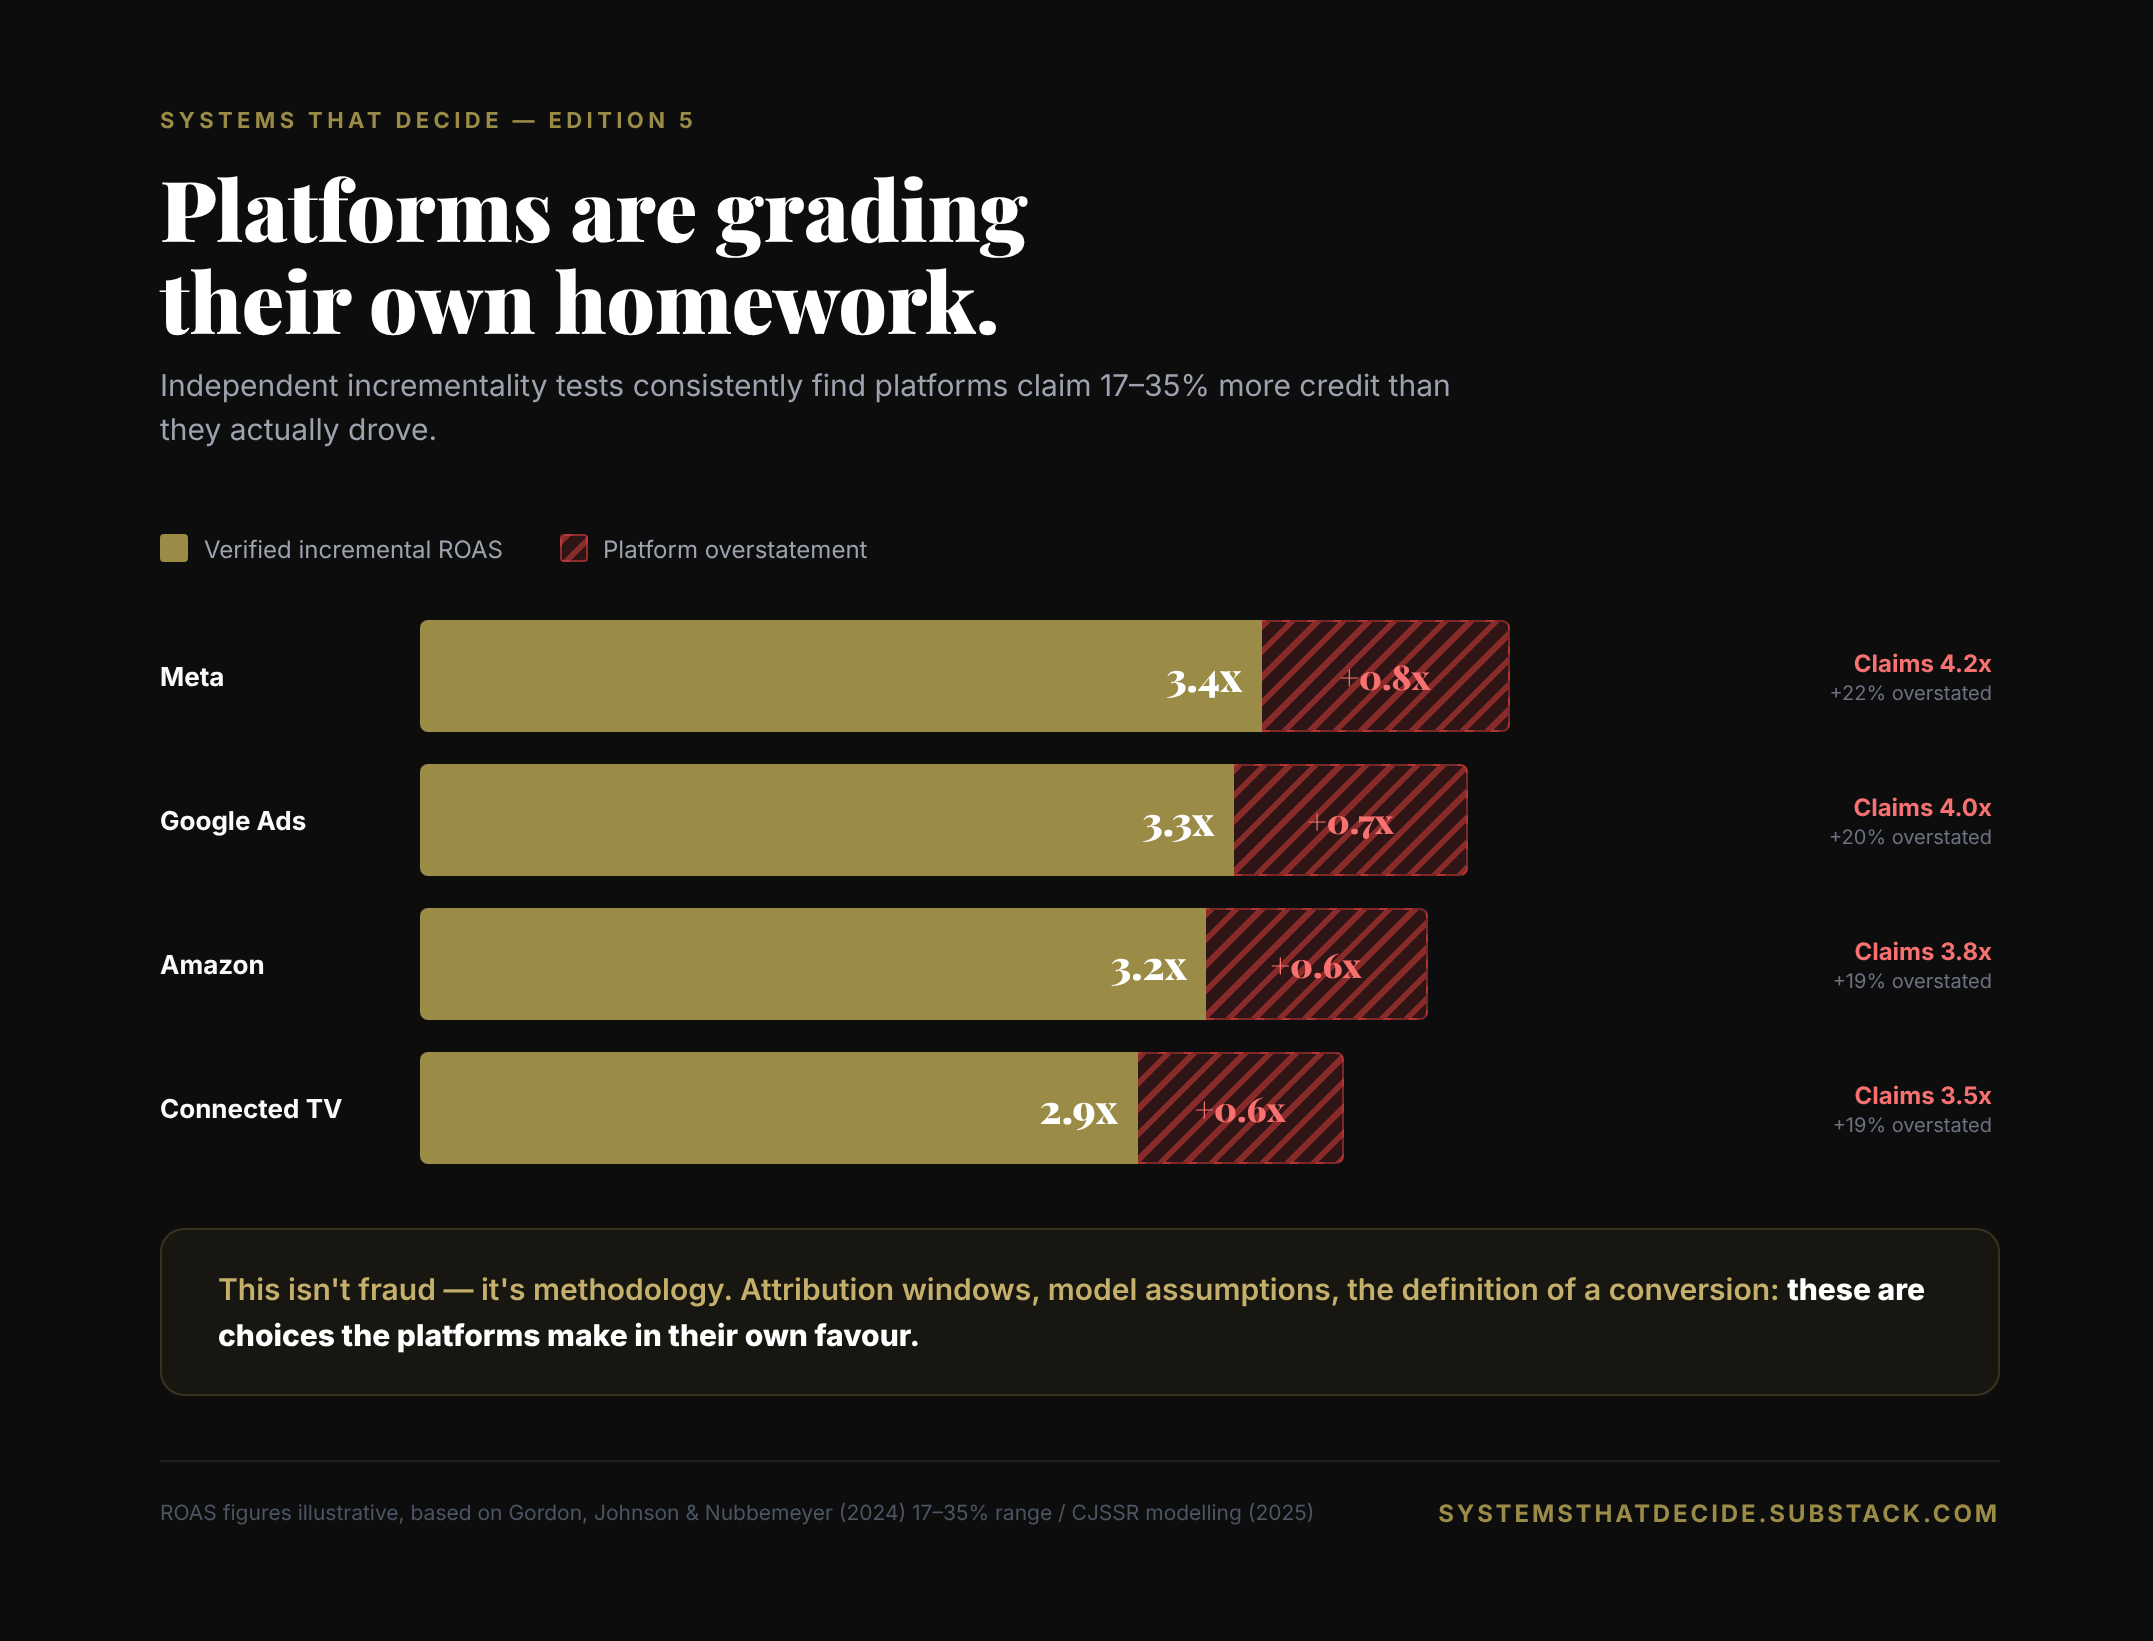
Real-world meta-analysis of walled garden platforms consistently finds systematic over-attribution in the range of 17–35% when platform-reported ROAS (return on ad spend, meaning the revenue your campaigns generate per dollar invested) is compared against independently verified incremental returns. The walled gardens sit at the higher end of that range; Connected TV, with cleaner exposure data, tends to sit lower. The direction is consistent. The magnitude is material.
This isn’t fraud. It’s the natural output of a system where the incentives aren’t aligned with yours. Attribution windows, model assumptions, the definition of a conversion: these are methodology choices. In a system where the measurer and the media owner are the same entity, those choices will trend in a predictable direction.
When you see a 4.2x ROAS in Ads Manager (meaning the platform claims you earned $4.20 back for every $1 spent), you’re looking at a number produced by a system where the incentives point toward a high number. That’s not a small caveat. That’s the whole game.
---
Two systems, zero agreement.
The r=0.02 correlation between MMM and MTA outputs on channel effectiveness rankings is the clearest expression of this. Two independent measurement systems, analysing the same spend, producing essentially random agreement on which channels are working. That finding comes from simulation modelling, but it’s consistent with what any practitioner who has run both methods on the same client will tell you off the record.
Both systems are trying to answer the same question: which channels are driving outcomes? If they were measuring reality, they should agree. They don’t.
They disagree because they have fundamentally different failure modes.
MTA can only measure what it can track (which is increasingly little) and it’s structurally biased toward conversion-stage channels that leave visible digital signals. The last click, the final retargeting ad, the search term. Awareness spend, offline media, brand activity: invisible.
MMM can see the broader picture, but it’s a statistical model that requires a lot of data and a lot of judgment. The judgment lives in the assumptions baked into the model: what it’s told to believe before it looks at the data. A poorly built MMM can tell you almost anything you want to hear.
Used alone, each method is dangerous. Used together, they contradict each other.
Retargeting is the cleanest illustration. Across hundreds of incrementality experiments, retargeting repeatedly claims more credit than it deserves. The attribution system credits the ad. The incrementality test often shows the conversion was going to happen anyway. Same spend, fundamentally different verdicts.
---
The iceberg.
Most attribution captures what’s visible above the waterline: direct response, trackable conversions, last-click events.
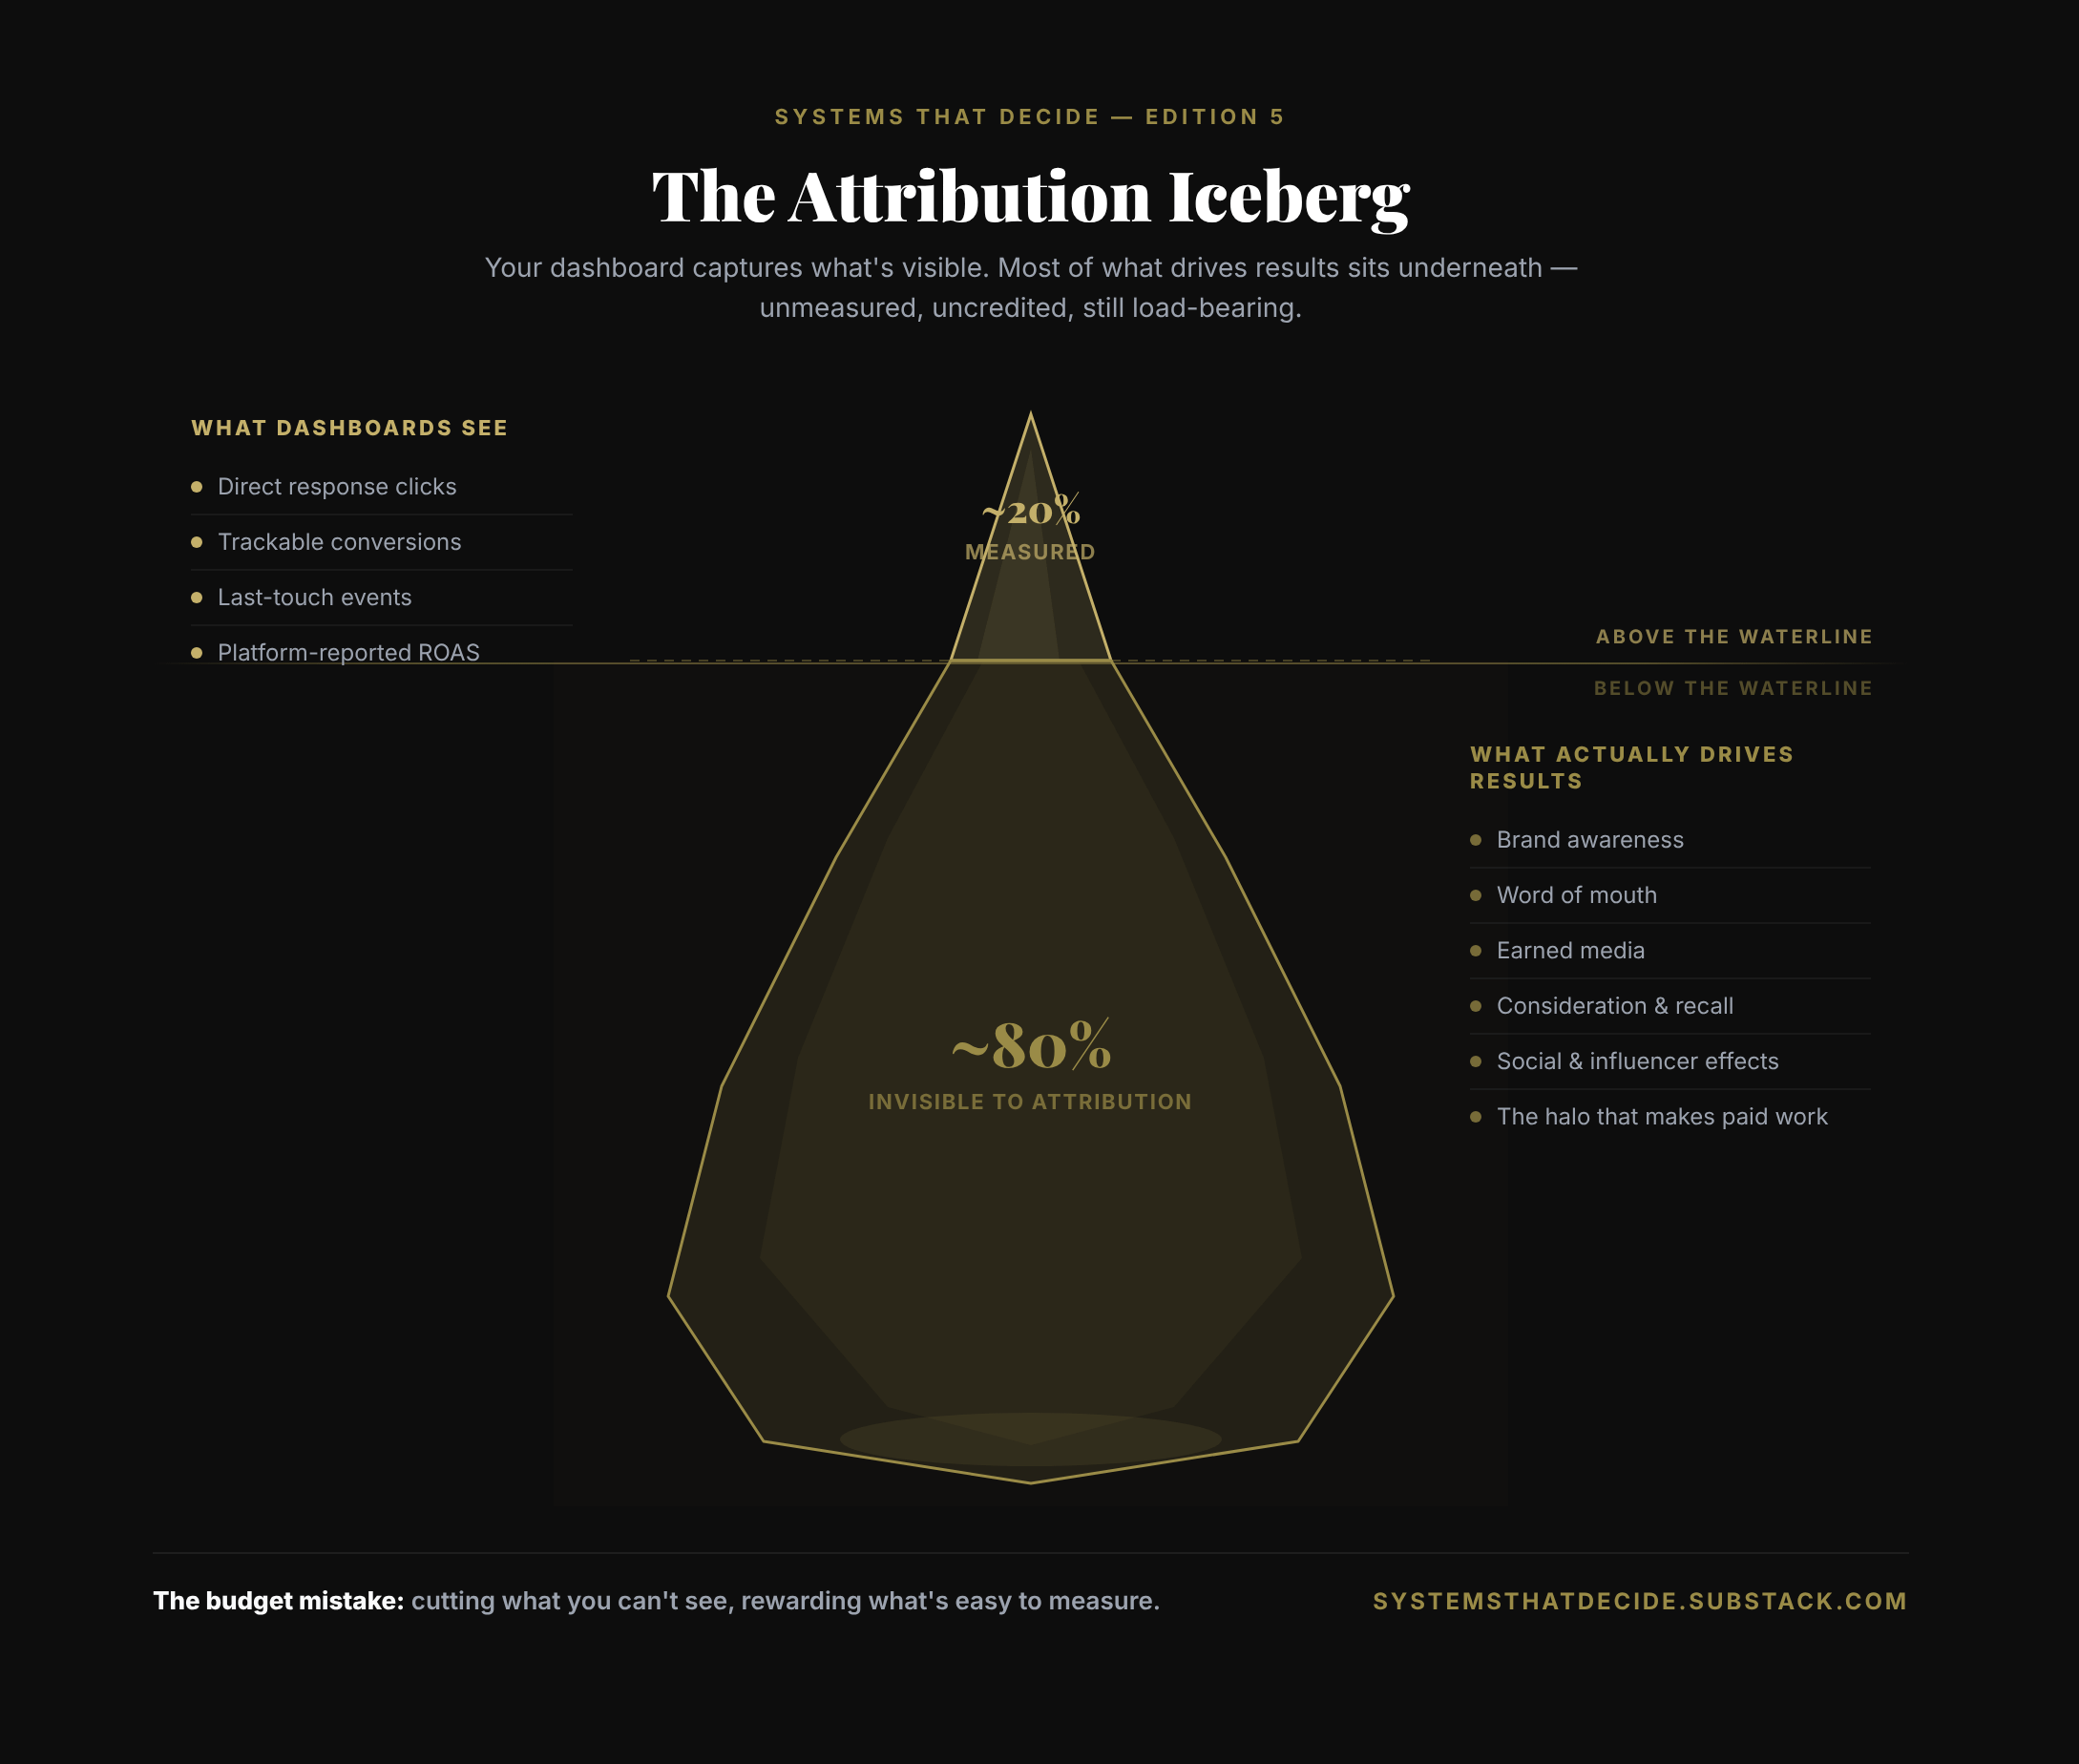
Below the waterline: brand awareness, earned media, word-of-mouth, the halo effect of being recognised before a customer is even thinking about buying. Everything that makes your paid performance channels work better because your brand already exists in the customer’s mind.
Research suggests a significant share of marketing’s actual effect, conservatively more than a quarter, sits in channels that even sophisticated measurement frameworks struggle to attribute: social, affiliate, influencer, awareness video. The activity is happening. The impact is real. The number in your dashboard is zero.
This is why budget optimisation based purely on reported attribution systematically underfunds brand and awareness activity. You’re cutting the stuff you can’t see. You’re rewarding the stuff that’s easy to measure, not necessarily the stuff that’s working.
---
What good looks like.
The answer emerging from the serious measurement work (academic, practitioner, platform-agnostic) is triangulation.
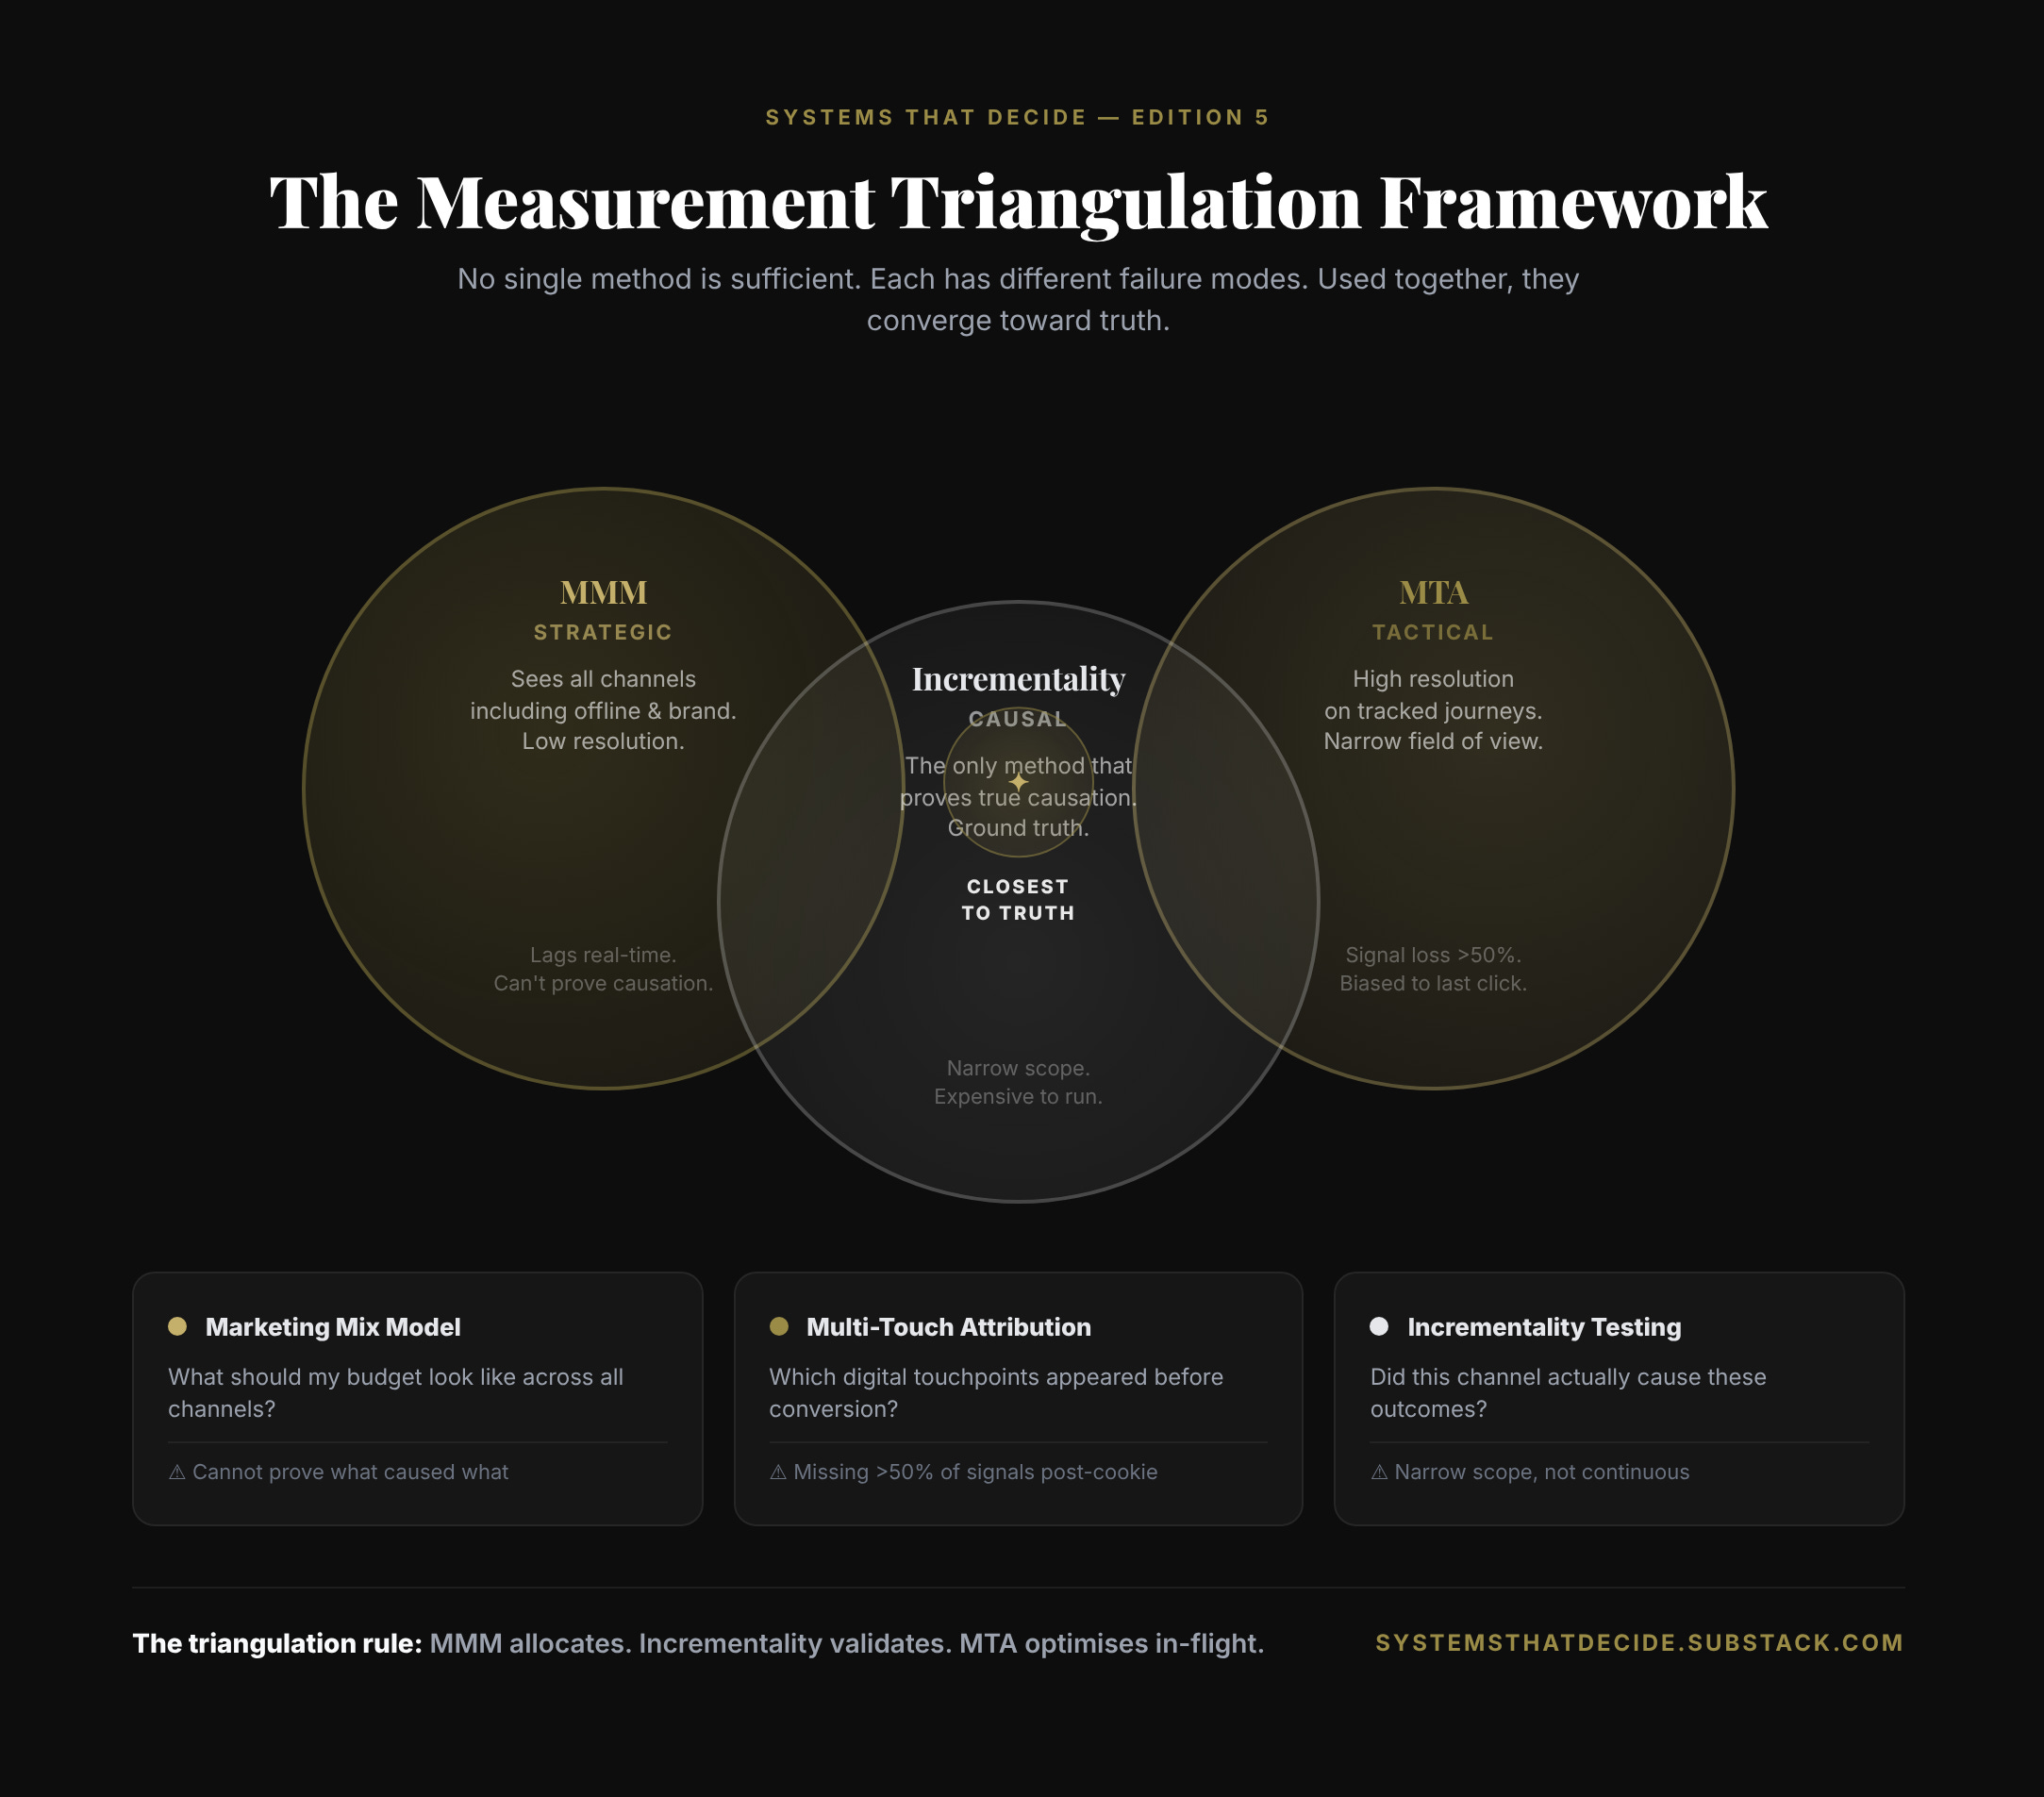
Not a single source of truth. Three methods with different failure modes, used together to converge toward something closer to reality.
Marketing mix modelling for strategic allocation. MMM sees the whole picture, including offline media and brand effects, but at low resolution.
Multi-touch attribution for tactical optimisation within channels, where data completeness is sufficient. High resolution, narrow field of view.
Incrementality testing, specifically geo-lift experiments, as the causal check on both. The only way to know if your MMM or your MTA is telling the truth is to run controlled experiments that isolate the actual incremental effect of turning spend on or off.
None of these methods is sufficient alone. Each anchors the others.
---
Where you are on the journey.
A useful way to locate yourself is the five-level measurement maturity ladder that’s become common currency in the MMM space, popularised by Mutinex. Most organisations, when they’re honest about it, land on Level 1 or 2.
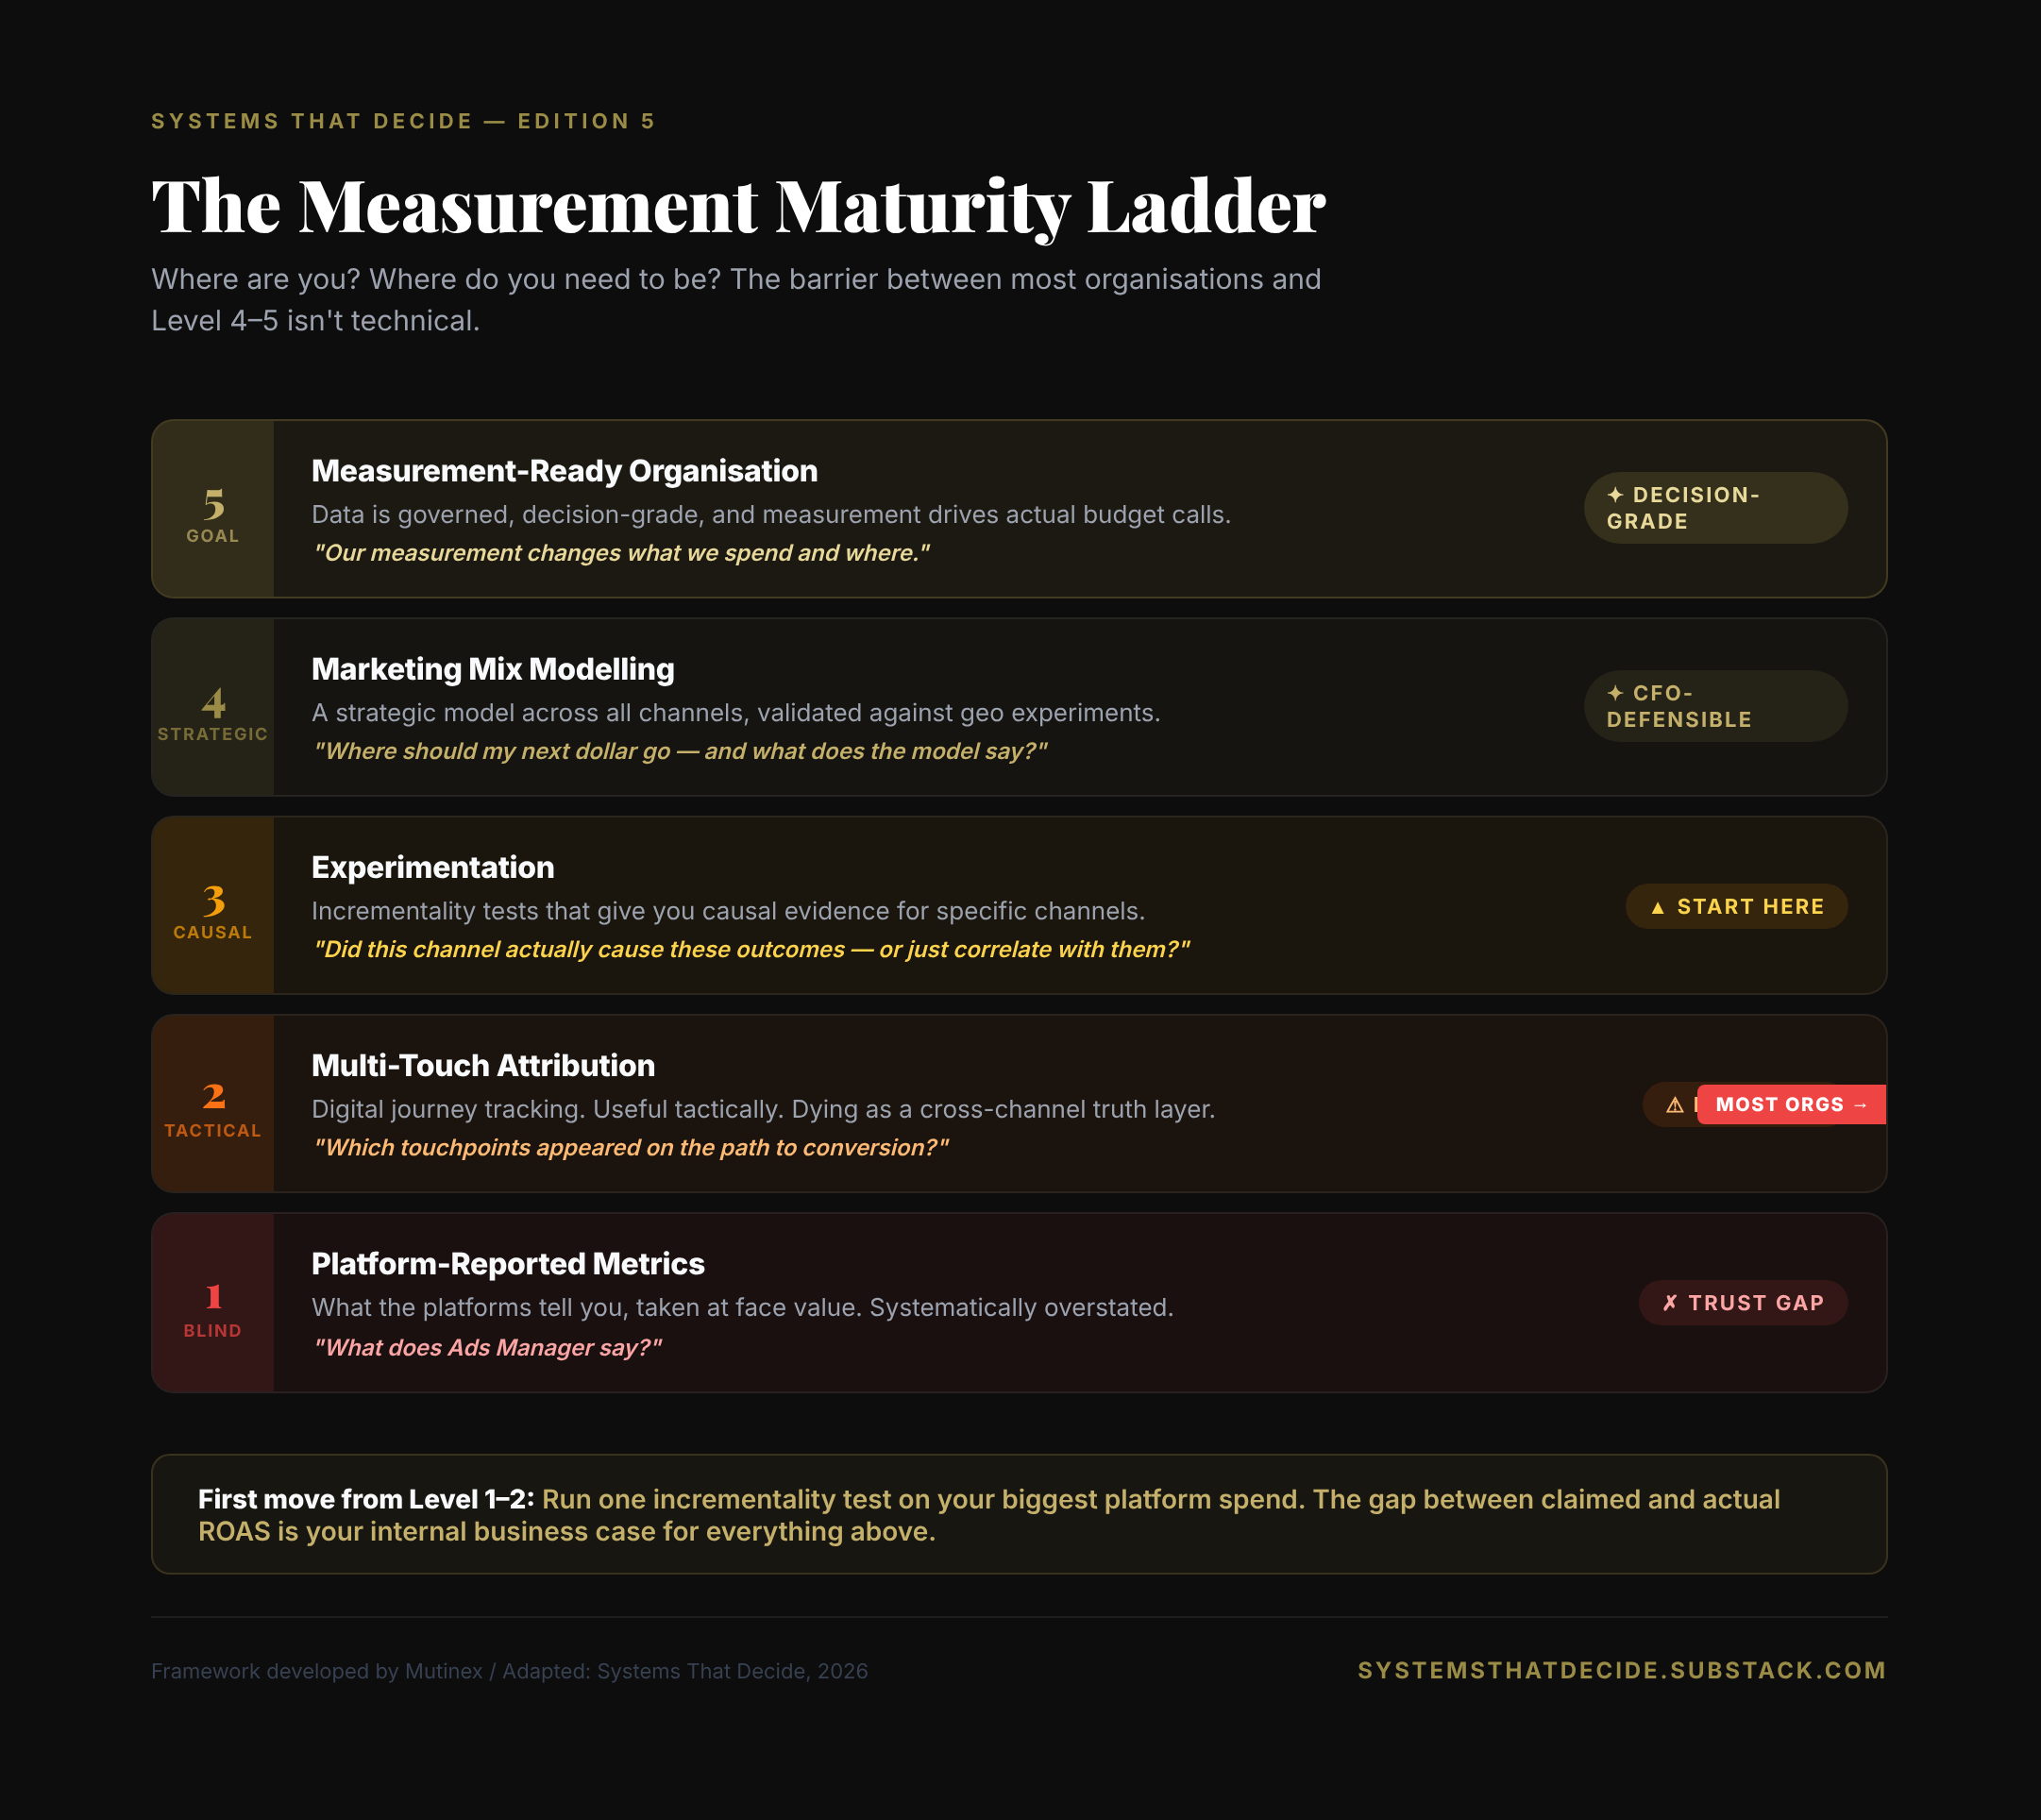
Level 1: Platform-reported metrics. What the platforms tell you, taken at face value.
Level 2: Multi-touch attribution. A more sophisticated view of the customer journey, still dependent on trackable signals.
Level 3: Experimentation. Incrementality tests that give you causal evidence for specific questions.
Level 4: Marketing mix modelling. A strategic-level model integrating all channels, validated against experiments.
Level 5: Measurement-Ready Organisation. Data is governed, decision-grade, and the measurement infrastructure drives actual budget decisions.
The tools to reach Levels 4 and 5 are more accessible than they’ve ever been. The barrier isn’t technical.
Research across 197 senior marketing leaders puts it plainly: the confidence gap in measurement is “as much human and organisational as it is technical.” The data is there. The question is what counts: who decides, based on what, and whether the measurement actually changes the decision.
A governance question. Not a data question.
---
Not all MMMs are equal.
The generation of marketing mix models most companies are running is a regression model fit to historical data. It produces a coefficient for each channel: essentially a score representing how strongly that channel appears to drive outcomes. The channel with the highest score gets more budget.
The problem: a model fit to historical data tells you what worked in the past, at past spend levels, in past market conditions. It doesn’t tell you what happens if you double spend in a channel, if the market shifts, or if you enter a new geography.
The better approach, now accessible through open-source tooling and specialist vendors, is a Bayesian MMM. Bayesian just means the model deals in probability and uncertainty rather than false precision: it updates as new evidence comes in, and it tells you how confident it is rather than pretending it knows. It models diminishing returns (the point where spending more in a channel stops paying back at the same rate) and carryover effects (the way ad exposure keeps working even after a campaign ends). Crucially, it’s calibrated against real experiment results, so its outputs are grounded in what you’ve already tested, not just assumed.
The practical difference: a standard model tells you a channel returned 3.2x and presents that as fact. A good Bayesian MMM tells you the likely return sits between 2.4x and 4.1x, with 70% confidence, and here’s where that confidence gets thinner. A range, not a point. Honest, not precise-but-wrong.
This matters enormously for the CFO conversation. “Spend another $2M in brand” is a hard sell.
“Our model gives us strong confidence in a positive return over 18 months, calibrated against geo experiments, with a range we can defend” is a different conversation.
It’s still uncertain.
But it’s honestly uncertain.
The open-source options: Meta Robyn, Google Meridian. Commercial: Recast, which builds causal structure directly into its models and integrates geo-lift testing; Mutinex, an Australian-built platform now working with brands including Optus, ING, SEEK, Asahi and Domino’s. The local market has more mature tooling than most teams realise.
The Iconic is the clearest local proof. In February 2024, while Shein and Temu were extracting nearly $3 billion from Australian fashion retail and traditional competitors were exiting the market, The Iconic shifted investment toward brand. The ‘Got You Looking’ masterbrand campaign drove a 34% increase in unprompted brand awareness over 12 months. ANZ NMV (net merchandise value, meaning the total value of goods sold through the platform), which had declined 12.6% in Q4 2023, grew 9.4% in Q4 2024. GFG’s CEO credited the brand reset directly. That’s the commercial argument MMM is built to make. In this case, the numbers moved with it.
---
The geo experiment problem.
Incrementality testing sounds clean in theory. Turn spend on in some markets. Turn it off in others. Compare.
In practice, it’s harder in Australia than almost anywhere else.
Australia has eight states and territories, several of them very small. Major metro populations are dense and concentrated. Classical randomisation (split markets cleanly, assign to treatment and control) doesn’t produce reliable results at the scale most Australian brands can actually run.
The practical fix is synthetic control methods: tools like GeoLift and CausalImpact that construct a statistical comparison market from a combination of real ones, rather than requiring clean geographic separation. They were designed for exactly this problem. They don’t eliminate uncertainty, but they handle small markets far better than a standard template applied without thought.
Methodology choice matters as much as budget. The template will give you results. It won’t tell you when those results are wrong.
---
Once teams accept that measurement is a systems problem, infrastructure questions follow.
Clean rooms: right tool, wrong expectations.
Data clean rooms let two parties analyse shared data without either side seeing the raw records. For retail media specifically, matching your sales data with a retailer’s ad exposure data, a clean room is often the only privacy-compliant way to close the measurement loop. If retail media is a meaningful share of your spend, you need a clean room strategy.
If it isn’t, you probably don’t.
The fragmentation problem is real: a Google clean room doesn’t interoperate with a Meta clean room, and the skills required to run meaningful analyses are significant. Clean rooms are useful infrastructure. They are not, on their own, a measurement strategy.
---
Where to start.
If you’re at Level 1 or 2 on the maturity ladder, the first move isn’t to build an MMM.
It’s to run one incrementality test on your biggest platform spend.
Pick your largest channel. Run a geo holdout or conversion lift study. Compare the platform’s claimed ROAS to the incremental ROAS the test reveals. You will almost certainly find a gap. That difference between what the platform says it delivered and what it actually caused becomes your internal case for better measurement. It’s also the number that changes the conversation with your CFO.
From there: build the data foundation. Clean, consistent, at least two years of weekly spend and outcome data. Then commission or build an MMM. Then run geo experiments to calibrate it. Then treat the maturity ladder as a governance document, not a research exercise.
The whole stack doesn’t have to arrive at once. But it has to start somewhere.
Start with the test.
---
Measurement is the operating system.
Measurement is not a reporting function. It is the system by which marketing capital is allocated.
If the system produces numbers that are wrong, because of platform conflict of interest, signal collapse, a model built on wrong assumptions, or organisational inertia, the allocation decisions that follow are wrong. Systematically. At scale.
The CFO conversation is changing. It used to be enough to point at the dashboard. It isn’t anymore. The question is shifting from “what did the platform report?” to “what did we actually cause?” That question has no good answer if your measurement is borrowed from the platform running the media.
The teams that get ahead of that question, with methodology the CFO can scrutinise and grounded in real experiments, will find the budget conversation gets easier. The ones still working toward it will find it gets harder every cycle until they do.
The window is now. Not when the CFO asks. Before.
That’s not a bad thing. The old measurement was convenient. The new measurement might actually be true.
Next edition: retail media. The same measurement problem, compressed into a walled garden where the retailer controls the shelf, the audience data, and the attribution. The conflict of interest is structural. The opportunity is real. More soon.
---
Systems That Decide publishes on the infrastructure of decision-making in modern business. If this edition was useful, share it with someone who should be asking harder questions about their attribution stack.
Am loving learning from you Gilbo!